

WePC is reader-supported. When you buy through links on our site, we may earn an affiliate commission. Prices subject to change. Learn more
Last Updated:
Releasing the first 1 Gigahertz processor with the original Athlon and bringing in the 64-bit version of the x86 instruction set, AMD have often been ahead when it comes to technological advancements. This time around AMD has partnered with TSMC to produce the first 7 nanometer desktop processors in the form of the Ryzen 3000 series. In addition to this smaller process node, AMD has also ushered in its revolutionary and highly scalable chiplet design. This sees 6, 8, 12 and 16-core parts on the desktop and up to 64 cores in AMD’s EPYC 7002 series of server processors, codenamed Rome.
The 3rd generation introduces a new Ryzen 9 tier encompassing the 12-core, 24-thread 3900X and the upcoming 16-core, 32-thread 3950X. A mightily impressive amount of computational power on the mainstream desktop that is competitive with intel’s expensive High-End Desktop (HEDT) parts. Furthermore, The Ryzen 9 processors in particular have a mammoth 72MB of Level 3 cache, questionably marketed as “Gamecache”, which should aim to mitigate the latency issues we saw with Ryzen 2000 resulting in improved gaming performance.
As the title suggests, we will be looking at the gaming performance of the Matisse CPUs, more commonly known as the Ryzen 3000 series. With its higher base clock of 3.8GHz, boost clock of 4.6GHz and 12-cores to dispense, the 3900X leads the benchmarks in our gaming suite, though not by much. AMD’s Ryzen 5 3600 with a base clock of 3.6GHz, boost clock of 4.2Ghz and 6-cores is the weakest processor in the line-up, but doesn’t fall as far behind as you might think. For now, let’s take a look at the test system and testing procedures.
Ryzen 3000 CPUs


Test System
- Asus TUF Gaming X570-Plus (WiFi) Motherboard
- Corsair Vengeance RGB Pro 16GB (2 x 8 GB) DDR4 3200 MHz C16
- Sapphire Radeon RX 5700XT
- Crucial MX500 250GB (Operating System)
- Samsung 860 QVO 1TB (Games)
- Corsair CS Series 550 Watt 80 Plus Bronze
- Fractal Design Define R5
- Windows 10 Home 1903 (18362.295)
- BIOS 1005 AGESA Patch ABB
- AMD Chipset Driver 1.07.29.0115
- AMD RADEON ADRENALIN EDITION 19.7.5
- BIOS Defaults
- XMP Profile 3200 16-18-18-36-1T
Testing Methodology
- A clean install of Windows 10 Home edition is used with Windows Defender disabled
- A game’s launcher runs in the background for the duration the game runs, for example, uPlay only runs whilst benchmarking Tom Clancy’s Rainbow Six Siege and is closed before moving onto the next game
- A batch script is run to close background applications, so only mandatory system applications are running in addition to MSI Afterburner, RTSS and Elgato sound capture
- Video footage is captured via an Elgato HD60 S that sits between the graphics card of the test system and the monitor
- AMD Radeon Settings were left at default. This meant that FreeSync, Virtual Super Resolution, and Radeon Image Sharpening were turned off. For more detailed display settings and Global Graphics, settings see the below images
Benchmarks
The Witcher 3
A route on horseback is taken seeing Geralt from Tretogor Gate to Novigrad Docks. No mods are installed, so we are restricted to trotting through Novigrad rather than galloping. This benchmark focuses on object streaming as we enter new areas and is supplemented with a vast number of NPCs with their own pathing and AI.

The tour through Novigrad sees the 3700X, 3800X, and the 3900X close together reaching an average framerate of 129FPS, 5% higher than the 123FPS of the 3600 and 3600X. The 1% lows of the 8-core and 12-core CPUs are about 10% higher than the 6-core parts. The 0.1% lows are close with all Ryzen CPUs delivering a similarly smooth experience.
With twelve cores, twenty-four threads, and a clock speed of 4.6GHz, the 3900X still sees moments where GPU utilization drops below 99%. At the two-minute mark, for example, we are CPU-bottlenecked as GPU usage sits around 80% and the first three CPU cores reach 100% usage. Interestingly, the threads sit relatively idle, regularly sat at 0% and only jumping to 19% once in a while. Memory bandwidth could be an issue here as the game engine streams in new assets related to the Novigrad Docks.
On the whole, all CPUs offer a smooth gaming experience in The Witcher 3, but the 3700X and up are smoother still for those with high refresh rate monitors.
HITMAN 2
The Finish Line is the second available location in Hitman 2 with simulation-heavy objects such as racing cars, NPCs and plenty of flags. Agent 47 observes the race before turning to see the crowd of spectators behind. The benchmark attempts to simulate a demanding but realistic playthrough making use of instinct mode, wading through crowds, blending in, and an intense cutscene.

Cutscenes, especially those with multiple camera angles, have to stream in a lot of new assets and the game engine remains stalled until they are loaded. Waiting on objects to load in results in severely reduced 0.1% lows. These numbers do not accurately reflect the gameplay experience so we’ll instead look at the data taken before the cutscene in the graph below.
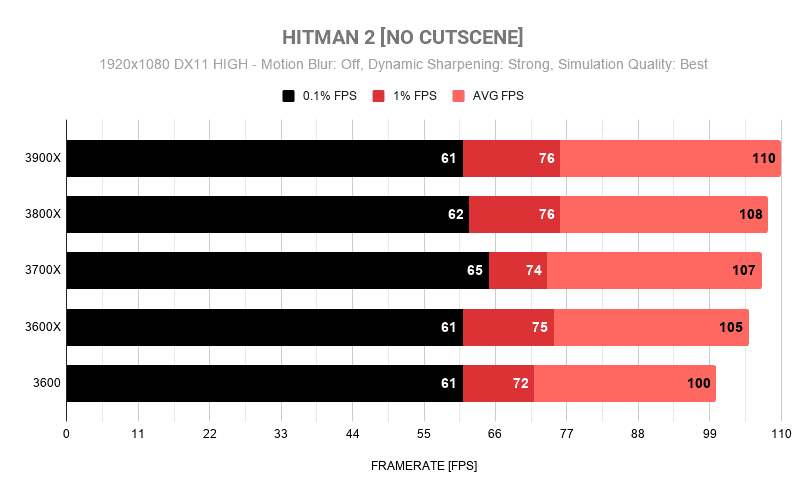
We can see all CPUs paired with the Radeon RX 5700 XT offer a similarly stutter-free experience with 0.1% lows above 60FPS. The processors discern themselves in the average framerates; the 3900X leads the pack with 110FPS, 10% faster than the Ryzen 5 3600 with 100FPS.
The difference in performance likely comes down to raw clock speed, with the 4.4GHz 3600X being 200MHz faster than the cheaper 3600 at 4.2GHz. The 3700X and 3800X boost higher still at 4.5GHz and the 3900X precedes at 4.6GHz. Whilst Hitman 2 may utilize multiple threads; it seems the game does not scale beyond six cores and twelve threads. Frequency becomes the dominating factor.
Note: The DX11 API is used instead of DX12 as it offers better 1% and 0.1% lows resulting in a smoother and realtively stutter-free experience.
Shadow of the Tomb Raider
Starting at Temple District in The Hidden City, we see Lara Croft descend many steps, make her way through the busy Paititi Market and settle at a base camp in the Fishing District. This benchmark, similar to the previous two games on this list, looks at loading in assets for new areas and a high NPC count with unique path finding. This is the more graphically intensive of the games using the DX12 API and everything cranked to Ultra.

Note: The 0.1% low of the Ryzen 5 3600 processor at 17FPS is a mistake in benchmarking and should be assumed to be similar to that of the 3600X, roughly 27FPS. This was caused by starting the frame time data capture just before leaving the menu – entering and exiting menus stalls the game engine producing paltry 0.1% lows.
The system is GPU-bottlenecked for a majority of the run, sustaining a 99% GPU utilization. This culminates in the above bar chart with remarkably similar 0.1% and 1% lows and average framerates.
Shadow of the Tomb Raider makes use of all the cores and threads available to it, particularly so under the DirectX 12 renderer. There are still many elements of the game engine that are single-threaded however – exhibited with the first core occasionally hitting 100% usage. As in other open-world games, upcoming areas are loaded into memory as the player approaches them. Nearing the end of the run, Lara leaves Paititi Market and descends some steps, heading towards the Fishing District. GPU utilization drops from 99% and the frame-time graph spikes. There is only a brief instant the first core reaches 100% usage, so the system is reputedly starved for memory bandwidth in this section.
Ultimately, Shadow of the Tomb Raider sees very little performance difference at Ultra settings on the RX 5700 XT across the range of Ryzen 3000 processors, and any differences could simply be explained by the variance between runs.
Grand Theft Auto V
Offering extensive graphics settings, GTA V can be tuned to run on low-end hardware and yet still stress high-end systems with advanced graphics options such as extended distance scaling and extended shadows distance.
Pass 4 of the built-in benchmark is the most indicative of actual gameplay with flying, driving and a scripted action sequence ending with a collision into a tanker truck. With random traffic conditions, each run is unique and can see dissimilar performance statistics even on the same hardware; this is especially noticeable with the fuel truck crash where nearby vehicles also explode.
Very High settings were used with 2x MSAA, Grass quality and Ambient Occlusion set to High,” High Detail Streaming While Flying” on, with “Extended Distance Scaling” and “Extended Shadows Distance” at 50%. These settings provide high fidelity and smooth gaming experience.
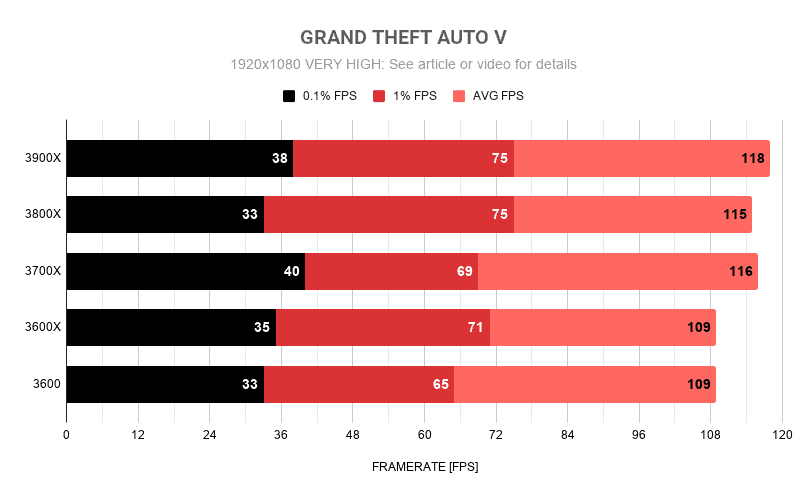
Built on RAGE, GTA V loves both frequency and thread count. From the bar chart it is apparent that the engine can put the extra cores and threads to use with the 3700X, 3800X and 3900X pulling away with an average framerate of 115, 116 and 118FPS, a 6-8% advantage over the 6-core 3600 and 3600X.
Both 1% and 0.1% lows are pretty similar among the group, but the 3800X and 3900X lead the pack for 1% lows with their faster clock speeds. There is no performance to be gained going beyond eight cores, and it appears the engine now favors frequency above all else.
GPU utilization is erratic throughout the benchmark, dipping to 50% in some instances and hovering around 80% on average. The first four CPU cores are heavily utilized, but threads seem to do minimal work only reaching 25% on occasion. By use of “High Detail Streaming While Flying“, the jet section of the benchmark stresses the memory system, relying heavily on bandwidth to stream in detailed objects rapidly; it seems that 3200MHz CL16 memory impedes the potential of the higher-end Ryzen 7 and Ryzen 9 parts here.
With our modified Very High settings, Grand Theft Auto V produces a comparable showing across the Ryzen 3000 range. Paired with an RX 5700 XT, there is little benefit investing in anything more than a Ryzen 5 3600 for this title.
Monster Hunter World
The tutorial sequence begins with a cutscene of a beautiful vista of the Ancient Forest littered with a few placid Aptonoth. Our Hunter continues following the Handler and the helpful scout flies as we make our way to Astera. On the way, we encounter a group of Jagras, and hiding is our only option. A Great Jagras attacks the Handler before Field Team Leader jumps in to help. The benchmark concludes with a turf war between the Great Jagras and an Anjanath as our Hunter leaps to safety.
This graphically demanding title pushes the graphics card with long draw distances, volumetric rendering and a sprinkling of alpha effects.
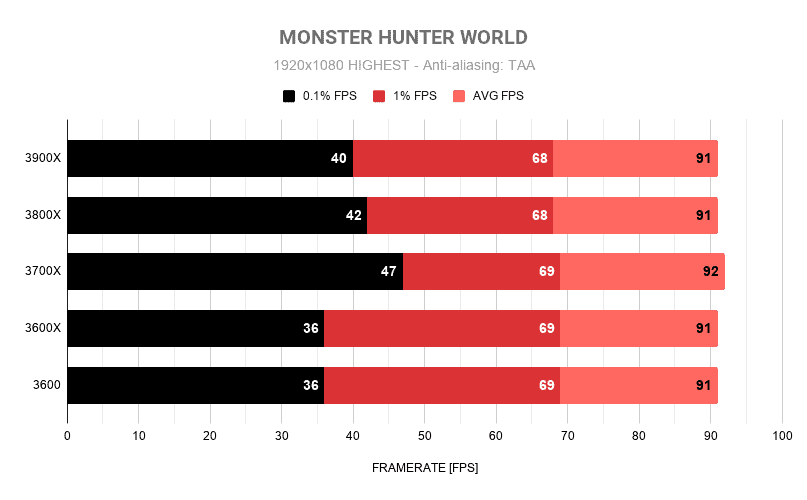
Another graphically demanding title, this time built on Capcom’s MT Framework engine. Little statistical difference can be observed between the processor line-up regarding 1% lows and average framerate. 8-core and 12-core parts deliver over 11% higher 0.1% lows than 6-core parts in this game; the 3700X’s 47FPS can only be explained as run-to-run variance. There is great utilization of CPU cores and modest use of threads, but pinned at 99% across the run, the Radeon card hinders the Ryzen CPUs. On account of graphics settings at their Highest there is negligible difference in the gameplay experience among AMD’s Ryzen 3000 series processors.
Total War: WARHAMMER II
Since 2000, Total War has seen numerous releases of the turn-based strategy game. Warhammer II is a highly acclaimed release from 2017 that is still punishing on modern high-end hardware which can be seen with the three built-in benchmarks: Battle, Campaign and Skirmish. The slower play style of strategy games means players favor image quality over high framerates which is why Ultra settings were used but with 2x anti-aliasing and Porthole quality set to 2D for actual gameplay. With hundreds of units on the screen in Battle and Skirmish modes, each with their own shadows and AI and the long draw distances for vegetation in the campaign, the game is exacting for both the graphics card and CPU.


Note: The DX11 API is used instead of DX12 as it offers better 1% and 0.1% lows resulting in a smoother and stutter-free experience.
Looking at the Battle benchmark, we can see the higher frequencies of the Ryzen 7 3800X and Ryzen 9 3900X yield the smoothest gameplay of the lot with 8% greater 0.1% lows. Otherwise, performance is identical. The campaign gives an indistinguishable performance profile as the system is entirely GPU bound. The run sees one or two CPU cores frequently peak at 100% usage, but this has no bearing on performance. Finally, Skirmish. 0.1% and 1% lows are closely bunched and marginally better for the higher core count CPUs. Additionally, average framerate is within a margin of error so a player’s experience would be identical no matter the processor. Studying the footage finds that minimal contribution is made by the threads in this title and the first two cores do the brunt of the work. There are instances in the Skirmish benchmark where GPU utilization falls.
With no CPU core hitting 100% usage for very long, it is likely that memory bandwidth is an issue once again. All CPUs will provide an excellent gaming experience for Warhammer II and its high graphical fidelity. The graphics card is a more important element in this title, and any card similar to the RX 5700 XT will be fully utilized with the Ryzen 5 3600.
Tom Clancy's Rainbow Six Siege
After testing a few game modes, the built-in benchmark wound up being the most taxing scene in the game. A camera moves through the house at midnight. Just before getting to the front, there is an explosion and the camera pivots to face a hostage situation in a room with static character models. The camera continues its journey as a second explosion blows a hole through one of the room’s walls. The benchmark ends as we pan through the door to the outside and overlook the street.

Rainbow Six Siege is a well-optimized title bearing very high framerates across the board. 0.1% and 1% lows are clustered around 160FPS for all but the Ryzen 5 3600; these are 11% and 6% slower. Running 200MHz slower than the 3600X and 3700X, lower clock speeds could be the cause here. The game makes good use of cores and decent use of threads. Video analysis proves the Radeon card once again is restricting the performance of these CPUs; 99% GPU usage is sustained and 100% CPU core usage is rarely seen. For the highest framerates in this competitive online game, a Ryzen 5 3600X and above is recommended.
Overwatch
Lijiang Tower’s First Control Point provides an uninterrupted view of the battle between two teams of six bots. The confined area, coupled with many alpha transparency effects from attacks, shields and healing and additional overhead with AI for all twelve bots results in a benchmark of a truly worst-case scenario. Health is set to 500%, and Hard bots are added so there are two minutes of intense fighting between the teams. Due to the nature of the game, each run is different, but over the two minutes, it is enough to show trends in performance.

For competitive Overwatch gaming, the 3700X and up prove their worth delivering 5-13% better average framerates depending on the CPU in question. 1% lows are roughly 14% better, but 0.1% lows are more or less equivalent (ignoring the extraordinarily high 108 FPS of the 3700X – every run plays out differently, attributing to this seemingly erroneous result).
Overwatch makes great use of CPU cores, heavily loading cores 1, 2, 3, 4 and 8, but threads remain underutilized. Rare is an instant in the hectic firefight that a core isn’t touching 100% usage – an entirely CPU bound gaming benchmark. Unfortunately, little use is made of the extra cores and threads of the Ryzen 9 3900X. In addition, this title does not appear to benefit from the extra 200MHz over the Ryzen 7 3700X, but this could be down to how dissimilar each run is.
Player Unknown’s Battlegrounds
For this benchmark the replay feature is utilized. Our resident pro-gamer Shaun played an FPP (First-Person Perspective) Squad match but ended up getting separated from the team. Despite the disadvantage, he ends up killing two players and witnessing an artillery strike which eliminates a third car-bound player.
PUBG is a notoriously unoptimized title prevalent with stutter and sees a minimal performance difference between Low and Ultra graphic settings. With smoke and fire, the graphics card has to be adept at handling particle and alpha effects, breakable objects such as the fence offer a small physics workload and running around the map tests the data streaming capabilities.
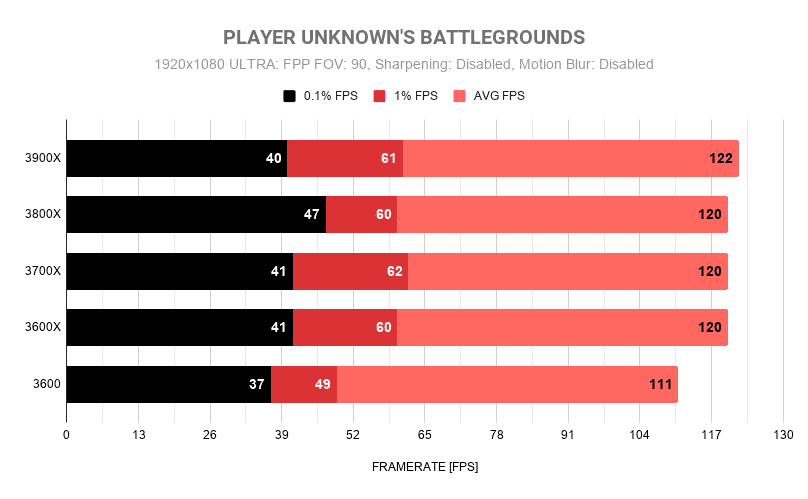
It is immediately apparent that Player Unknown’s Battlegrounds favors CPU core frequency, evident by the 4.4GHz 3600X and up pushing 120FPS – 8% faster than the 4.2GHz 3600. 1% lows are over 20% faster too! PUBG makes good use of four cores but minimally uses the extra cores and threads. Instances of the run see GPU utilization fall with infrequent 100% usage of a CPU core which suggests a memory bandwidth bottleneck.
Counter-Strike: Global Offensive
Succinct at only 40 seconds long, the benchmark utilizes a replay of an ESEA match seeing our CS: GO aficionado, Charles, wield an M4A1-S and throw a High Explosive Grenade. The Terrorists drop a Smoke Grenade to cover their position, but it’s all over in less than a minute with Counter-Terrorists winning.
This competitive online game went free-to-play in early December 2018, and keen players pursue high framerates for the lower input lag. A mixture of High settings were used as these offer a competitive edge: High Effect and Shader Detail allow the player to better see through Molotov fire; Higher Shadow Quality renders enemy shadows at a greater distance; 2x MSAA reduces the distracting crawl of hard edges.
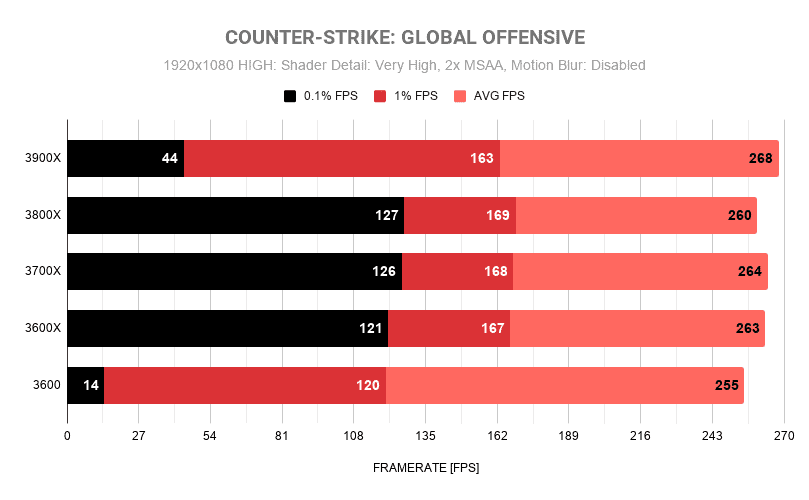
Note: Benchmarks for the 3600 and 3900X were repeated and produced similar results. This is abnormal benchmarking behavior likely caused by the replay feature. Actual gameplay performance is more in line with the other CPUs and should be assumed as such.
Making good use of only three cores, Counter-Strike: Global Offensive doesn’t benefit from the high core counts the Ryzen 5, 7, and 9 families deliver. Performance is essentially identical across the Ryzen 3000 range, producing average framerates upwards of 250FPS. The 3600 is the slowest of the bunch at 255FPS which is down to its lower clock speed.
That said, the 3900X doesn’t run away with its higher boost clocks and only earns a negligible victory over AMD’s other parts. Numerous moments where both the GPU and CPU core utilization are below 100% indicate a bottleneck elsewhere in the system – again, this suggests memory bandwidth issues. Overall, with the mix of graphics settings used here, coupled with the RX 5700XT, there is little difference between the processors for competitive CS: GO gaming.
DOTA 2
Searching for an intensive and representative benchmark for Dota 2 led to the article “Benchmarking Dota 2” from layerth, medium. The demo file is of Match 3787212636, GESC:Jakarta Minor between Infamous and VGJ: Thunder in the semi-finals.
The sequence includes lots of particle and alpha effects, creating a great workload for the CPU and graphics card. “Best Looking” settings were used, and the benchmark was run under the Direct3D 11 renderer as it offered the smoothest experience with the best 1% and 0.1% lows.
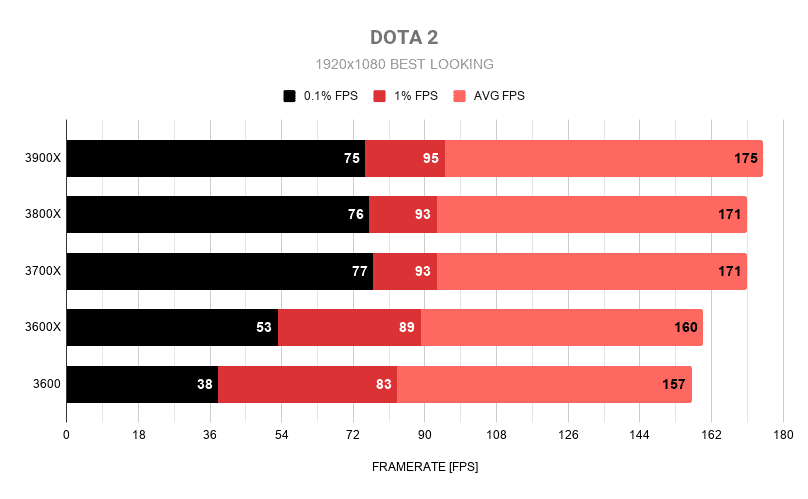
Note: The benchmark was started slightly earlier for the Ryzen 5 3600 while the game still loads assets. Actual gameplay performance is very similar to the 3600X and should be assumed as such.
GPU utilization hovers around the 50% mark through the benchmark pass with infrequent peaks to 70% in demanding sections with heavy particle and alpha effects. Reasonable load is observed across the many cores of the Ryzen processors though threads sit relatively idle. It is common to see one or two cores pegged at 100% in addition to the low GPU usage, this indicates a heavy CPU-confined benchmark that is reliant on core count up to a point where frequency is paramount. Looking at the graph justifies the hypothesis. The two six-core Ryzen processors have worse average framerates and 0.1% lows. The 3700X and 3800X achieve identical numbers, and the 3900X narrowly wins on account of 175FPS for the average framerate.
AMD’s Ryzen 7 3700X and above should be considered for competitive DOTA 2 gameplay – yielding a far smoother gameplay experience and higher average framerates than the six-core parts.
Final Word

Those pairing a Radeon RX 5700 XT or equivalent GPU with one of AMD’s Ryzen 3000 series processors will be decidedly pleased with the performance. Whilst the Ryzen 9 3900X isn’t head and shoulders above the line-up, it manages to eke out the win in all titles tested, granting high average framerates and the smoothest gameplay experience – due, in part, to the 72MB “Gamecache”. Its higher boost clock of 4.6GHz also helps in more lightly-threaded games like CS: GO.
Unfortunately, our benchmark suite also highlights that many modern games don’t utilize more than eight cores and older games scarcely demand more than four. That said, productivity on the twelve core processor is unrivaled in its price-class and should be sought by those looking to do more than just game. The extra cores will also benefit those looking to game and stream to platforms like Twitch on a single machine.

With eight cores and sixteen threads, the Ryzen 7 3700X and 3800X both sit below the aforementioned Ryzen 9 3900X. With Boost clocks of 4.4GHz and 4.5GHz respectively, there is little to differentiate these two processors other than a 40W TDP and $70.
Looking through the graphs it is evident that these processors can discern themselves from the cheaper six-core Ryzen 3600 and 3600X, but with only a 6% lead in GTA V and 5% victory in The Witcher 3, demanding open-world games with high graphical settings profit very little from the two extra cores. Only in games like DOTA 2 and Overwatch do we see improvements of 6% and 12% in the average framerates, with the former seeing a hefty uplift in 1% and 0.1% lows resulting in a much smoother gameplay experience. Offering almost identical performance (the few graphs suggesting otherwise are due to the variance between runs), there is little reason to invest in the 3800X when the 3700X can be had for $70 less.
This money can be spent elsewhere in the build; on faster memory or a better AIB graphics card, for example. Only those interested in competitive online gaming with the likes of Overwatch, DOTA 2 or single-player enthusiasts of open-world games like The Witcher 3 and GTA V would we recommend purchasing the 3700X over the vastly cheaper Ryzen 5 3600.

Coming in at less than half the price of the 3900X, the Ryzen 5 3600 makes a good showing in our benchmarks. It offers the weakest performance of the Ryzen 3000 series but provides similar performance in more graphically demanding games such as Monster Hunter World and Shadow of the Tomb Raider. PUBG shows it falls reasonably short of the other CPUs both in smoothness and raw framerate and this is likely from its lower 4.2GHz Boost clock.
This also extends to other games like Tom Clancy’s Rainbow Six Siege where frequency is key. The 3600X adds 200MHz out of the box but is hard to justify for the extra $40 it demands. We would only recommend the 4.4GHz 3600X to those who do not want to experiment with overclocking or if it is within $10. Those looking for the best price-to-performance CPU should look no further than the Ryzen 5 3600.


