Gamer – Audiences, Behaviour, preferences & Time Spent Total
Need graph shortcode
Need graph shortcode
No items found.
Overview
Lorem Ipsum is simply dummy text of the printing and typesetting industry. Lorem Ipsum has been the industry’s standard dummy text ever since the 1500s, when an unknown printer took a galley of type and scrambled it to make a type specimen book. It has survived not only five centuries, but also the leap into electronic typesetting, remaining essentially unchanged. It was popularised in the 1960s with the release of Letraset sheets containing Lorem Ipsum passages, and more recently with desktop publishing software like Aldus PageMaker including versions of Lorem Ipsum.
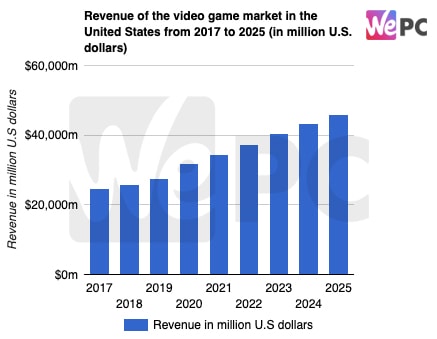
By 2025, the revenue from video games in the United States is forecasted to increase to roughly $46bn U.S dollars – this is up from $31.9 billion U.S dollars of revenue in 2020.
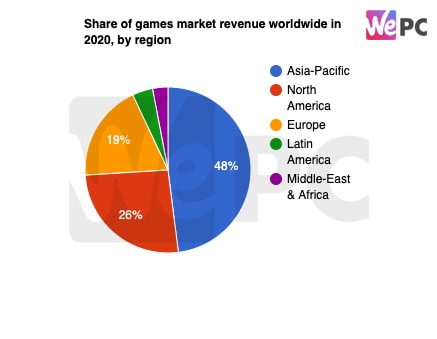
The graph presented shows the distribution of the games’ market revenue worldwide in 2020 and it is broken up in regions. The games market in the Asia-Pacific region was estimated to generate $84bn U.S dollars in revenue in 2020 – this was calculated to account for 48% of the global games market revenue that year.
In regards to penetration of gaming within households in the United States, at least 53% of U.S households report to owning at least one video game console. Additionally, 26% of respondents claim ownership of ‘new-gen’ console models including Microsoft’s Xbox Series X/S and the Sony PlayStation 5.All three of these models were released in November 2020.
From a survey conducted by the Statista Global Consumer Survey in 2021, 54% of respondents answered the question “Which of these devices do you use to play video games” with “Smartphone” in the U.S – this is followed by consoles (35%) and PC (32%).
In the United States, video games have generated $31.9bn U.S dollars in 2020 – this is an increase of 15% percent when compared to 2019. The Statista Advertising & Media Outlook estimates 8.2 and 8.5 percent revenue growth in 2021 and 2022.
It is estimated that the global gaming market in North America will amount to 268bn annually in 2025 – this is an increase from 178bn currently in 2021. North America is set to remain the top-grossing gaming market worldiwde regardless of the surge showing amongst the Asian regions.
Time Spent
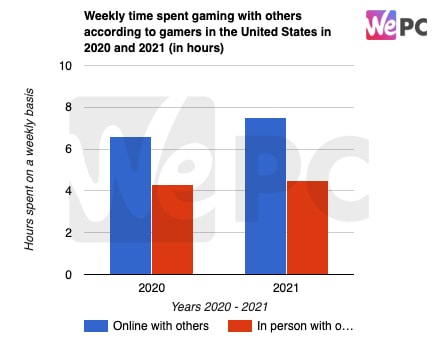
Online gaming is a big function of a video game has become increasingly common in parts such as the United States – in 2021, gamers in the U.S played approximately 7.5 hours of gaming per week alongside peers online. This is a gradual increase of 6.6 in 2020. Online seems to be more populated compared to in-person or local co-op.
General video gaming use in the U.S gradually increased due to the pandemic however when splitting it across genders – Men in the United States spent an average of 49.2 daily minutes playing games / using PCs as leisure compared to women who spent an average of 26.4 minutes per day for the same usage during May – December 2020.
A January 2021 survey found that in China they spend most of their hours spent on gaming per week in comparison to other countries with an average of 12.3 weekly hours of gaming time. Vietnam cam second with about 10.1 hours of gaming time per week. It’s to be noted that the global average of hours spent weekly is 8.4 hours.
Spending
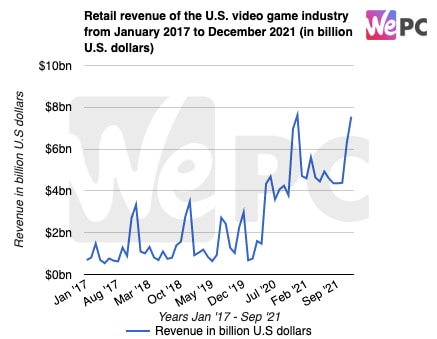
In December 2021, the retail gaming revenue in the United States amounted to a total of $7.5bn U.S dollars. When looking at particular segment revenues, accessories is the lowest performing segment at retail overall. Most sales and in turn the highest revenues have occurred during the holiday season which could be the reason why new game releases tend to be planned shortly before the winter holidays.
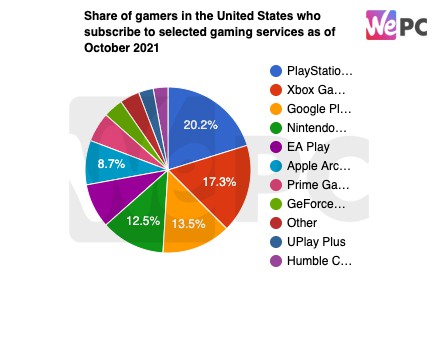
PlayStation Now has seen a 21% subscription rate making it the most popular subscription service amongst gamers – this is followed by Xbox’s Game Pass at 18%.
No items found.
42% of respondents answered the question “Where have you spent money online on digital video games in the past 12 months (downloads, in-app purchases, subscriptions)?” with “Amazon”
Overall, almost three quarters of responding console gamers stated that they subscribed to such services, which comes as no surprise as a service subscription is a requirement for online multiplayer on most platforms
An survey of gaming audiences in the United States in October 2021 found that approximately 52% of gamers subscribed to at least one subscription gaming service.
Within the third quarter of 2021, U.S consumer spending on gaming content increased four percent compared to the previous year. Hardware spending surged at 60% year-over-year growth due to the new console generation releases at the end of 2020 (Sony, Xbox) and improved availability of these products in 2021.
No items found.
eSports
United States have amasses the most eSports winnings across competitions through organisations with a total of $21.6 million U.S dollars followed by China at $16.9m and South Korea at $9.1m.
As of August 2021 – FaZe Clan have amassed the most audience across their social media channels of 17.7 million with most action per content of over 47,000. It’s to be noted however that regardless of audience size – G2 over the annual year have pumped out the most content of 555 across their socials.
There is an increase of interest of eSports when splitting it by gender with male viewership having a avid fan percentage of 15% compared to the female’s 3% with females having more of an absence within the industry of 85% not being a fan.
It’s to be noted however that while the eSports industry has gradually become an integral aspect of the entertainment industry, 72% of respondents from an online survey mentioned that they’re not a fan of eSports with only 9% being avid fans and a further 19% being fans of the product casually in the United States.
As of 2021, China has been anticipated to be the largest eSports market worldwide in 2021 with an estimation of $360.1 million U.S dollars generating within the industry.
Gaming Preferences
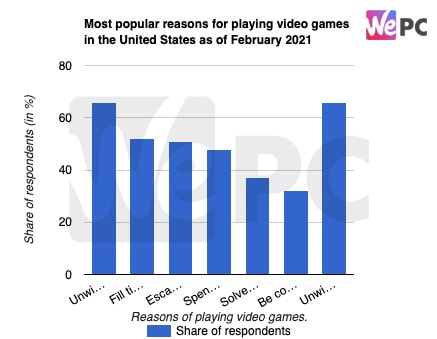
A survey in February 2021 found that approximately two thirds of gamers in the United States played games to – unwind, relax or decompress. Downtime during breaks, waiting and commuting came second as the most popular reason.
The displayed data on PC gamers preference conducted by the Statista Global Consumer Survey in 2020 mentioned that 44% of respondents stated that they play strategy games.
Within 2021, non gaming activities were deemed significant with 60% of gamers in the United States having participated in non-gaming activities in the last 12 months. Virtual recreations of social or life events were deemed the most popular with online interactions coming second following with live in-game concerts being third – notably Travis Scott’s Fortnite concert that occurred in 2020.
From the Statista Global consumer Survey which was conducted in the United States in 2020 – 56% of respondents mentioned that they play action-adventure games.
A February 2021 survey of gamers in the United States found that 63 percent of respondents enjoyed playing casual games such as Tetris or Solitaire regularly. Alongside this, a further 39% of responding gamers stated that they played action games on a regular basis.
Gaming Audiences
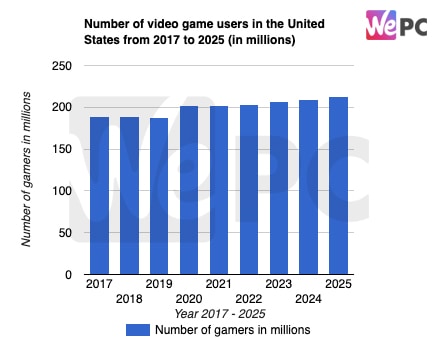
In 2020, the number of video gamers in the United States stood at 201.9m, up from 188.2m digital gamers in the previous. Gaming purchases have been increasing in popularity due to COVID-19 accelerating these numbers. It’s forecasted that by 2025 they’ll be 213.3m digital gamers within the United States.
In the United States, mobile gamers are forecasted to grow from 150m in 2020 to 181m in 2025 with an upwards trajectory amongst different segments including downloading games, gaming networks and online games as the graph shows.
In 2020, approximately 39.7% of gaming audiences were women, with the other 60.4% percent being male in the United Kingdom.
In 2021, women in the United States accounted for 45% of gamers – this is an increase of 41% of U.S gamers identifying as women in the previous year and is seeing a positive trajectory.
The number of video gamers in the United Kingdom is expected to grow from 44.3m in 2021 to a trajectory of 51.8m million in 2025 via Statista’s Digital Market Outlook.
Time Spent
Online gaming is a big function of a video game has become increasingly common in parts such as the United States – in 2021, gamers in the U.S played approximately 7.5 hours of gaming per week alongside peers online. This is a gradual increase of 6.6 in 2020. Online seems to be more populated compared to in-person or local co-op.
General video gaming use in the U.S gradually increased due to the pandemic however when splitting it across genders – Men in the United States spent an average of 49.2 daily minutes playing games / using PCs as leisure compared to women who spent an average of 26.4 minutes per day for the same usage during May – December 2020.
A January 2021 survey found that in China they spend most of their hours spent on gaming per week in comparison to other countries with an average of 12.3 weekly hours of gaming time. Vietnam cam second with about 10.1 hours of gaming time per week. It’s to be noted that the global average of hours spent weekly is 8.4 hours.